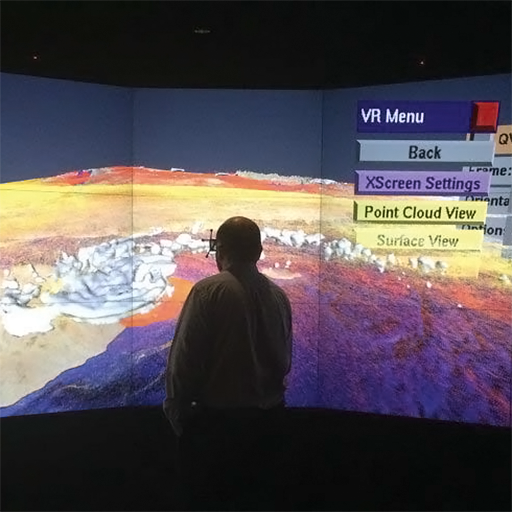


We specifically focus on the visualization of extreme-scale data, volume visualization, flow visualization, differential geometry and mathematical physics in visualization, large-scale image and volume processing, multi-resolution techniques, data streaming and out-of-core processing, domain-specific languages for visual computing, interactive segmentation, and GPU algorithms and architecture.
We are very happy and honored that our IEEE VIS 2025 paper “Exploring 3D Unsteady Flow using 6D Observer Space Interactions” has received a Best Paper Honorable Mention Award at IEEE VIS 2025. Congrats, Xingdi and colleagues!!
We will present two full papers at the IEEE VIS 2025 conference in Vienna, Austria: The paper “Exploring 3D Unsteady Flow using 6D Observer Space Interactions”, and the paper “Locally Adapted Reference Frame Fields using Moving Least Squares”. Congrats, Xingdi and Julio!
We will present two full papers at the Eurovis 2025 conference in Luxembourg: The paper “Lactea: Web-Based Spectrum-Preserving Multi-Resolution Visualization of the GAIA Star Catalog”, and the paper “Enhancing Material Boundary Visualizations in 2D Unsteady Flow through Local Reference Frame Transformations”.
“Analysis and Synthesis of Digital Dyadic Sequences” in collaboration with Abdalla G. M. Ahmed, Mikhail Skopenkov, and Peter Wonka, has been accepted for presentation at ACM SIGGRAPH Asia 2023 in Sydney, Australia, December 2023, and publication in ACM Transactions on Graphics.
We are very happy and feel very honored that our IEEE VIS 2023 paper “Vortex Lens: Interactive Vortex Core Line Extraction using Observed Line Integral Convolution” has received a Best Paper Award at IEEE VIS 2023. This is the third award (two Best Paper Awards, one Honorable Mention for Best Paper Award) at IEEE VIS for our work in flow visualization in the last four years!
We will present three papers at IEEE VIS 2023 in Melbourne, Australia, in October 2023: Our VIS 2023 paper “Vortex Lens: Interactive Vortex Core Line Extraction using Observed Line Integral Convolution”, our VIS 2023 paper “Residency Octree: A Hybrid Approach for Scalable Web-Based Multi-Volume Rendering”, in collaboration with Harvard University and TU Wien, and our TVCG paper “GPU Accelerated 3D Tomographic Reconstruction and Visualization from Noisy Electron Microscopy Tilt-Series”.
Our PhD student Reem Alghamdi presented our paper “Doppler Volume Rendering: A Dynamic, Piecewise Linear Spectral Representation for Visualizing Astrophysics Simulations” at Eurovis 2023 in Leipzig, Germany, in collaboration with the Max Planck Institute for Astronomy, and Heidelberg University.
We will present our course Riemannian Geometry for Scientific Visualization at SIGGRAPH Asia 2022 in Daegu, South Korea. Check out the course webpage and the updated extensive course notes!
We presented two papers at IEEE VIS 2022: Our VIS 2022 paper “Multivariate Probabilistic Range Queries for Scalable Interactive 3D Visualization”, and our TVCG paper “Real-Time Visualization of Large-Scale Geological Models with Nonlinear Feature-Preserving Levels of Detail”.
We are honored that our IEEE VIS 2021 paper “Interactive Exploration of Physically-Observable Objective Vortices in Unsteady 2D Flow” has received a Best Paper Honorable Mention Award at IEEE VIS 2021.
We will present our tutorial on Riemannian Geometry for Scientific Visualization at IEEE VIS 2021. Check out the extensive course notes and make sure to check back for updated versions!
We are honored that our CGI 2021 paper “A Practical and Efficient Model for Intensity Calibration of Multi-Light Image Collections” with CRS4 Visual Computing has received the Best Paper Award at CGI 2021.
We are honored that our IEEE VIS 2020 paper “Objective Observer-Relative Flow Visualization in Curved Spaces for Unsteady 2D Geophysical Flows” has received the Best Paper Award at IEEE Scientific Visualization 2020.
You can now also follow our group on twitter: @vcc_vis.
We are very happy to welcome our new MS/PhD student Xingdi Zhang, and our new Post-Doctoral Fellow Dr. Alberto Jaspe-Villanueva to our group!
Browse selected publications here. See for a full list of publications below.
Here are resources for our teaching, including tutorials and graduate courses at KAUST.
This is a tutorial on Riemannian Geometry for Scientific Visualization, presented at the IEEE VIS 2021 conference. We introduce the most important basics of Riemannian geometry and related concepts with a specific focus on applications in scientific visualization. Extensive course notes are available for download.
This course is held each fall semester and covers the architecture and programming of GPUs (Graphics Processing Units). Covers both the traditional use of GPUs for graphics and visualization, as well as their use for general purpose computations (GPGPU). GPU many-core hardware architectures, shading and compute programming languages and APIs, programming vertex, geometry, and fragment shaders, programming with CUDA, Brook, OpenCL, stream computing, approaches to massively parallel computations, memory subsystems and caches, rasterization, texture mapping, linear algebra computations, alternative and future architectures.
This course is held each spring semester and covers the basics and applications of scientific visualization. Techniques for generating images and interactive visualizations of various types of experimentally measured, computer generated, or gathered data. Grid structures. Scalar field and volume visualization. Vector field and flow visualization. Tensor visualization. Applications in science, engineering, and medicine.
We are hiring PostDocs and PhD Students!
We are offering internships and we invite visiting students to join us for a research stay!
King Abdullah University of Science and Technology is an international, graduate research university in Saudi Arabia located directly on the shores of the Red Sea. The University is dedicated to advancing science and technology through interdisciplinary research, education, and innovation to address the world’s pressing scientific and technological challenges related to water, food, energy, and the environment. KAUST is home to world-class faculty, scientists, engineers and students from around the globe. The University’s award-winning campus has everything you need to live, work, study and play. Designed to inspire and motivate our faculty, students, staff and their families to maintain an active lifestyle, KAUST is more than a university. With state-of-the-art fitness facilities, a golf course, numerous fine dining and casual fare restaurants, elementary and secondary schools, and of course, the Red Sea just steps away, there is something for everyone.
To get an initial understanding of what we are interested in and in which research field you could work at our group, see the project descriptions below.
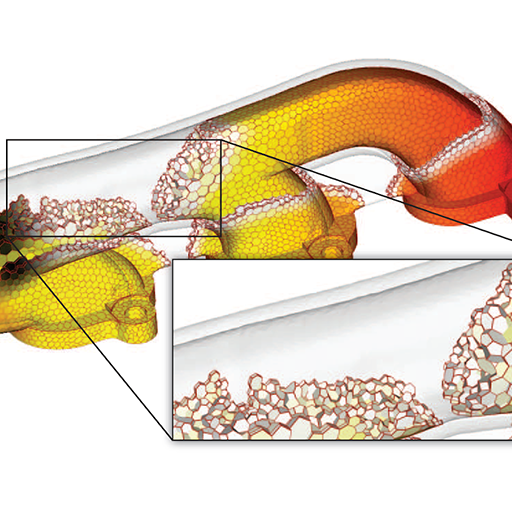
Very large volumetric meshes are of crucial importance in many areas such as large-scale computational fluid dynamics (CFD) simulations, whether for car engine design or for simulating oil and gas reservoirs. Recent computational advances have led to computational grids of extreme size, such as trillion-cell reservoir simulations. The size and complexity of such grids pose a tremendous challenge to interactive visualization and analysis, and require the development of novel data structures for visualization, e.g., polyhedral grid data structures, as well as data structures for efficient querying and analysis.
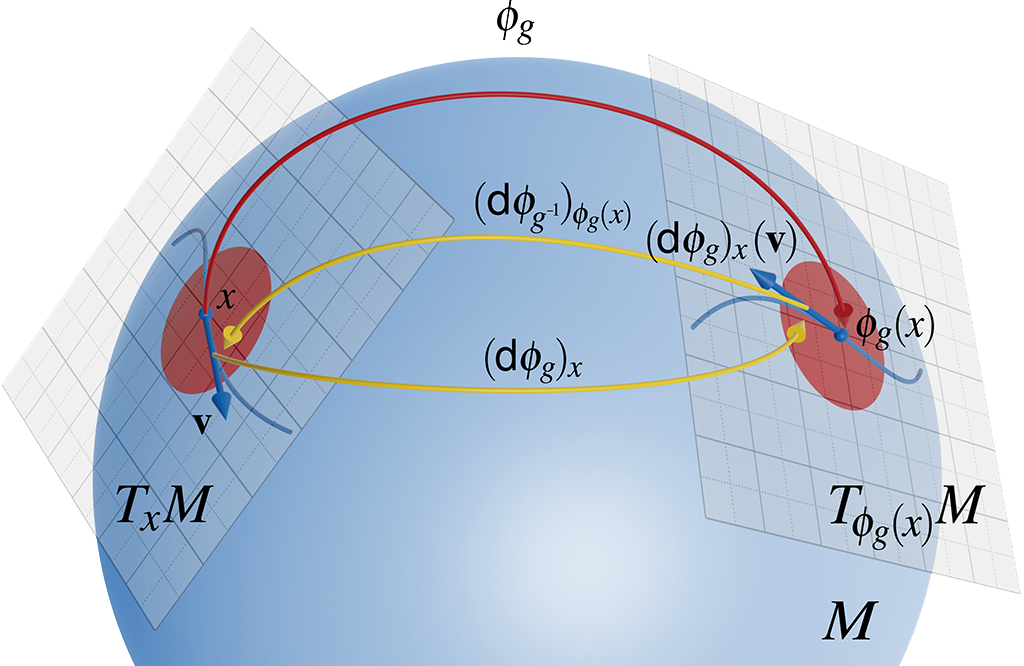
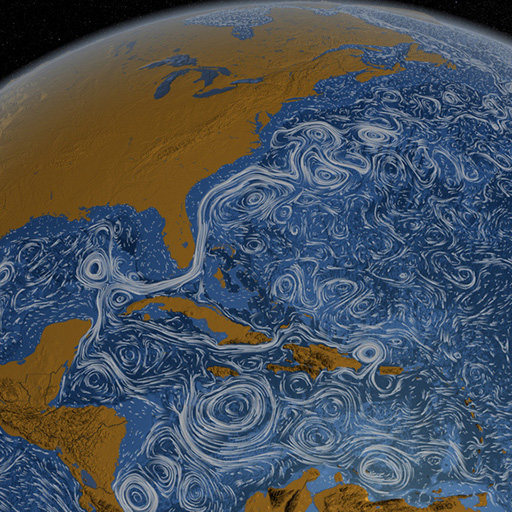
more infoDifferential geometry provides a powerful mathematical framework for describing physical processes from cosmology and general relativity to planet-scale fluid flow, such as large-scale eddies in the oceans or hurricanes, whether on Earth or on Jupiter. The combination of modern differential geometry, such as exterior calculus/differential forms and Riemannian geometry, mathematical physics, and scientific visualization is a very exciting area where modern differential geometric methods can help achieve a very high degree of generality, for example generalizing and unifying flow analysis from flat Euclidean space to curved manifolds such as the Earth’s surface. (Image by NASA/Goddard Space Flight Center Scientific Visualization Studio.)
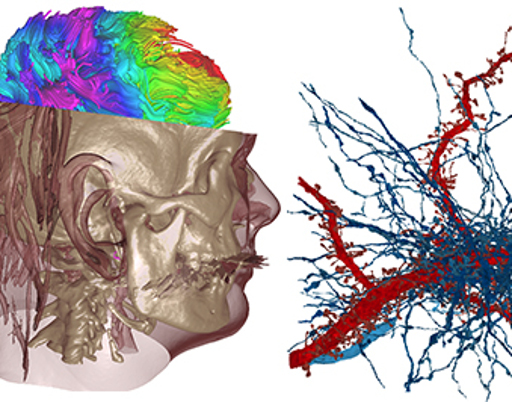
more infoReconstructing the anatomical and functional connectivity of the brain has become one of the most active research areas in neuroscience. By ultimately mapping and deciphering a human’s entire connectome, i.e., the full “wiring diagram” of the brain comprising billions of neurons and their interconnections, scientists hope to gain an understanding of how the brain develops and functions, and how pathologies develop or can be treated. To support these goals, high-throughput methods for neural imaging have been developed. A major challenge going forward, however, is the lack of sufficiently powerful tools for interactive visualization and analysis. We design and develop prototype tools for tackling this challenge and help neuroscientists answer fundamental questions about our brain. Representative examples of our work are Abstractocyte for understanding astroglial cells, NeuroLines for interactive neuronal connectivity analysis, and ConnectomeExplorer for answering domain-specific questions using visual queries.
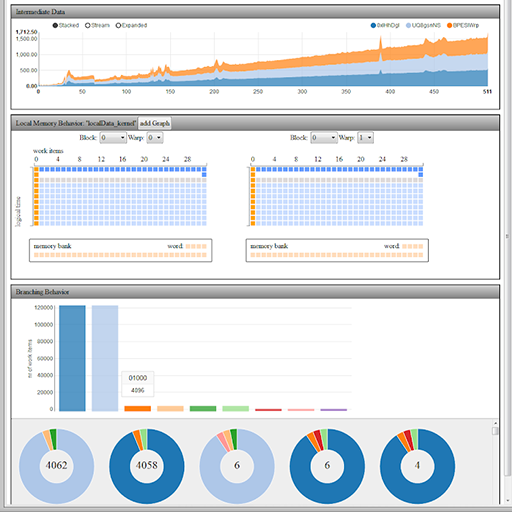
more infoMany modern computational problems are inherently massively data-parallel. Research areas such as simulation, data-science and visual computing are increasingly dealing with data-parallel problems. For instance in visual computing parallel algorithms are needed for image processing, geometry processing, visualization, computational imaging, and many other subfields where the data primitives are parallel. In this project we develop novel domain specific languages that offer visual abstractions of different aspects of the programs. The parallel program development is aided by instantaneous visualizations of the underlying primitives of the algorithms. For instance in fluid simulation the parallel data primitives can be equipped with semantics like “particle” or “vector” which leads to different instantaneous visualizations. The development of better parallel programming languages is a research field with increasing importance as most modern computational problems need to be tackled with data-parallel algorithms.
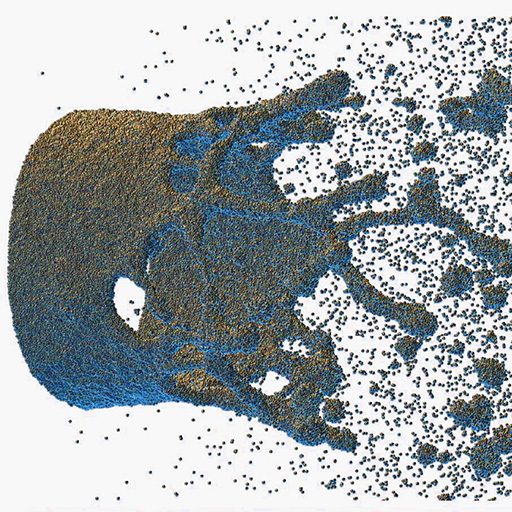
more infoMolecular dynamics simulations are crucial to investigating important processes in physics and thermodynamics. The simulated atoms are usually visualized as hard spheres with local lighting, like Phong or Lambert shading, where individual particles and their local density as well as larger structures can be perceived well in close-up views. However, for large-scale simulations with hundreds of millions of particles, the visualization usually suffers from strong aliasing artifacts. The mismatch between data size and output resolution leads to severe under-sampling of the geometry. This makes exploration of unknown data and detection of interesting phenomena via a top-down approach difficult. We introduced the novel concept of screen-space normal distribution functions (S-NDFs) for particle data. S-NDFs represent the distribution of surface normals that map to a given pixel in screen space, which enables high-quality re-lighting without re-rendering particles.
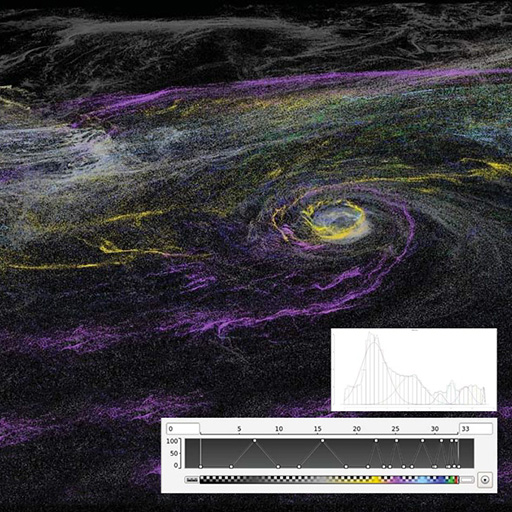
more infoLarge-scale simulations result in enormous amounts of data. Visualization or even just transfer of the complete simulation data is a time consuming and tedious task. Extracting the essential part of the data is usually done after the entire simulation is finished. Since the storage capacity of the simulation servers is limited, not all data can be permanently stored and is only available during the simulation itself. Domain scientists are typically scanning the stored results looking for specific features in the data. The essential data covers just a tiny amount of the entire data space. Our approach attempts to detect features concurrently to the simulation. Due to temporal as well as spatial data coherence, similar patterns can be detected and stored in dictionaries. In the optimal case the original data can be reconstructed by a linear combination of a small amount of dictionary entries.
more infoThis project investigates techniques for in-situ visualization of large time-dependent volume data. Since state of the art large scale simulations can generate petabytes of data, not all data can be stored to permanent storage media. Usually the spatial dimensions are downscaled or only a small subset of the temporal series is stored. Our approach to in-situ visualization analyzes the results as simulation time progresses and extracts the essential data characteristics from the preliminary results. Very low data transfer rates can be achieved by exploiting temporal coherence of successive simulation timesteps. Only a small subset of the data is transferred progressively to the visualization client. The reconstruction of the data in an early stage of the simulation run, combined with interactive steering approaches, reduces the risk of running unnecessary simulations and enables the informed modification of simulation parameters.
more info